Response analysis
Plotting the RAO
The RAO can be computed by Nemoh when specifying the proper input in the Nemoh.cal file.
--- Post processing ---------------------------------------------------------------------------------------------------------------
0 0.1 10.               ! IRF computation switch (0/1), time step and duration
0                       ! Body pressure output switch (0/1)
0 0. 180.               ! Kochin function: Number of directions of calculation (0 for no calculations), Min and Max (degrees)
0 10 100. 100.          ! Free surface elevation: Number of points in x direction (0 for no calcutions) and y direction and dimensions of domain in x and y direction
0                       ! Response Amplitude Operator (RAO) switch (0/1)
1                       ! Output frequency/period unit (1: rad/s, 2: Hz, 3: s)
After running postProc, the RAO can be found in the Motion directory. Open it with Tecplot to visualize the results, and select the desired component and wave direction in the Mapping Style window.
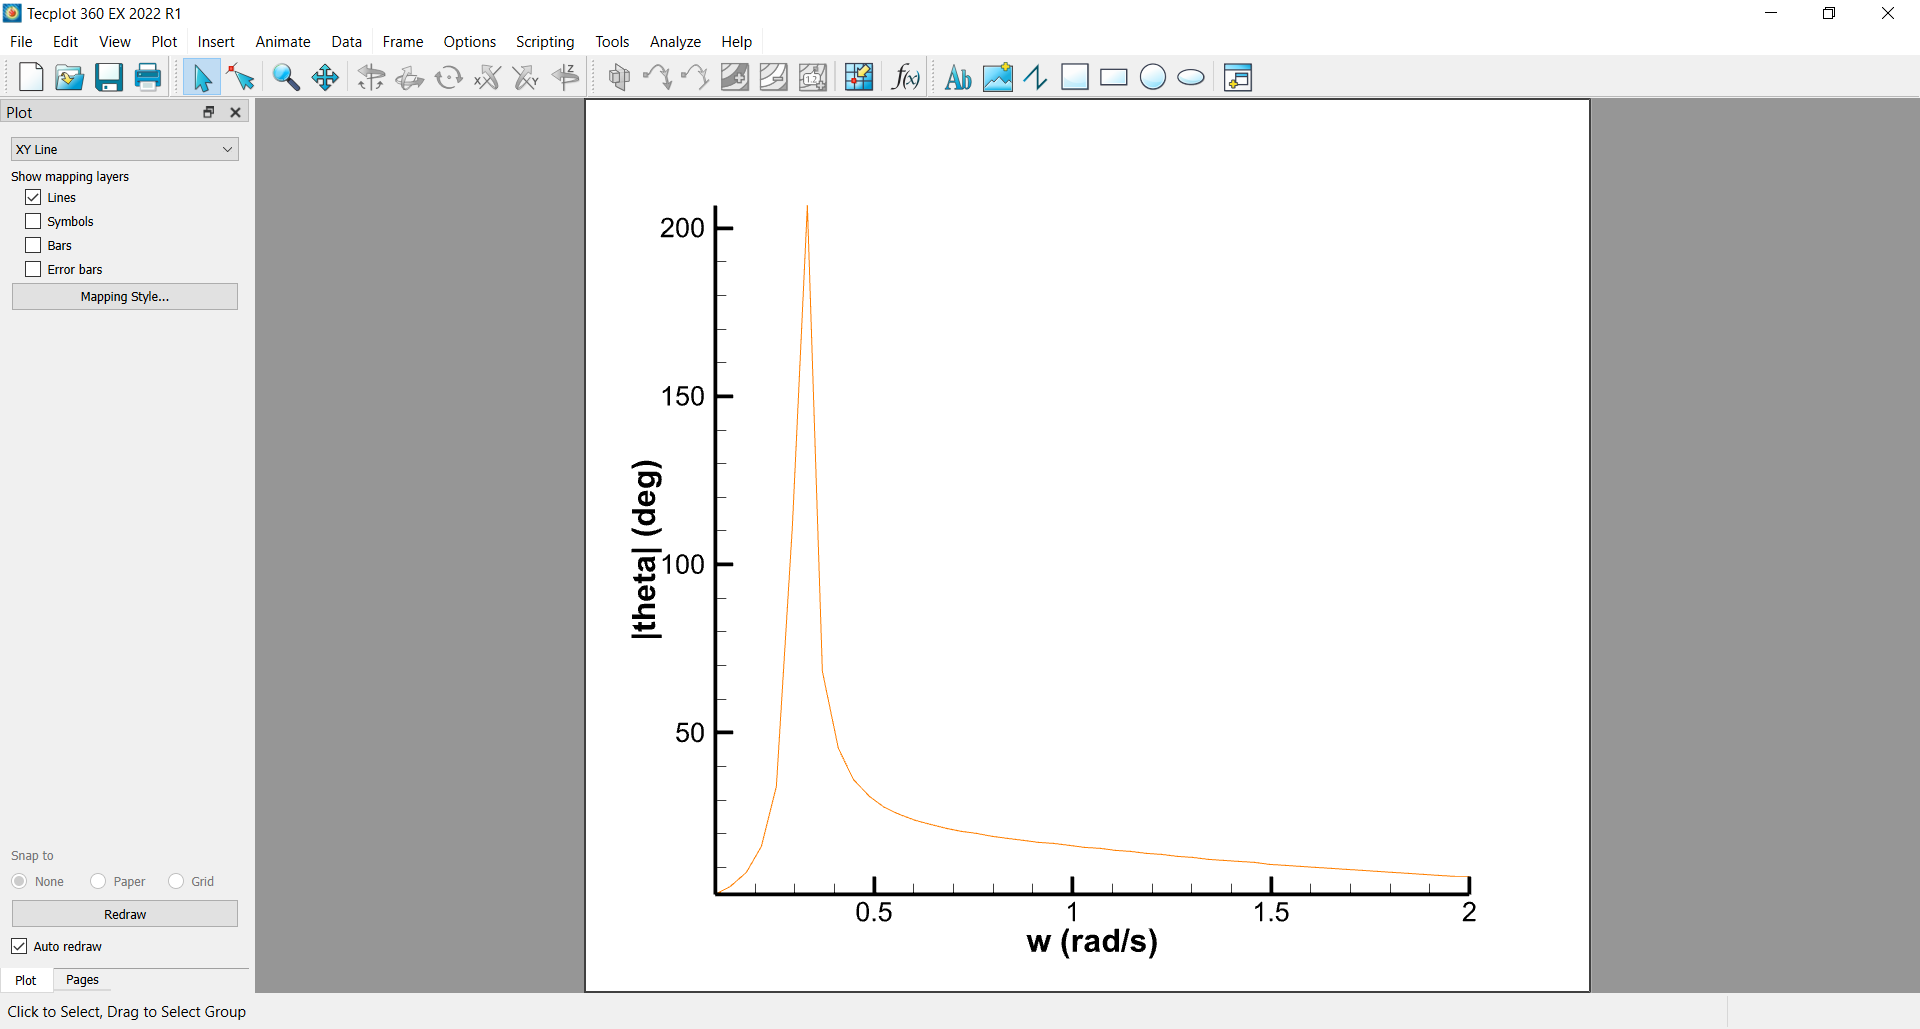
Analyse the RAO curve. It is typical to observe a peak at the natural frequency of the system, which is the frequency at which the system resonates, and asymptotes at high and low frequencies.
Hint
If you do not see the expected peak and/or asymptotes, consider increasing the frequency range in the Nemoh.cal file. This will require running the full workflow again.
Design choices
Resonance
The peak oberved in the RAO curve is the resonance frequency of the system. It is a frequency at which the system oscillates with a high amplitude. Except for Wave Energy Conerters (WEC), it is usually desired to avoid resonance, as it can lead to high stresses and damage to the system.
Note
A typical application of Nemoh if to check a design and make sure that the resonance frequency is not in the range of the expected wave frequencies.
The natural frequency can be adjusted by changing the mass and stiffness of the system. The natural frequency is given by:
Hint
When changing the mechanical properties of the system in the Mechanics directory, only running postProc again is necessary to update the RAOs.
Influence of stiffness
A linear stiffness matrix \(K_m\) can be added to the system in the Mechanics/Km.dat file.
Note
If the Mechanics/Km.dat file is absent when running hydrosCal, it will be created and filled with zeroes. If the file exists, il will be left as-is.
Stiffness is typically used to model a mooring system (as a first approach).
To do:
Try to add some stiffness to the system and observe the changes in the RAO curves.
Influence of damping
A linear damping matrix \(B_{add}\) can be added to the system in the Mechanics/Badd.dat file.
Note
If the Mechanics/Badd.dat file is absent when running hydrosCal, it will be created and filled with zeroes. If the file exists, il will be left as-is.
Damping is typically used to model energy dissipation in the system. Such dissipation can come from friction or wave breaking in the fluid, but also energy absorbed by the system (e.g. electrical energy in a WEC).
To do:
Try to add some damping to the system and observe the changes in the RAO curves.
Influence of mass
Added mass is linked to the amount of water displaced by the system in motion. It can only be modified by changing the geometry of the system, which also changes other hydrodynamic coefficients.
However, the rigid body mass/inertia of the system can be modified by changing the inertia matrix \(M\) in the Mechanics/Inertia.dat file.
To do:
Try to change the inertia of the system and observe the changes in the RAO curves.
Attention
Changing the mass of the system arbitrarily is not a realistic design change, because it would also change the hydrostatic equilibrium of the system. In practice, the inertia of the system can be slighly adjusted by changing the distribution of mass in the system. Actually changing the geometry of the submerged part of the system is a more realistic approach.
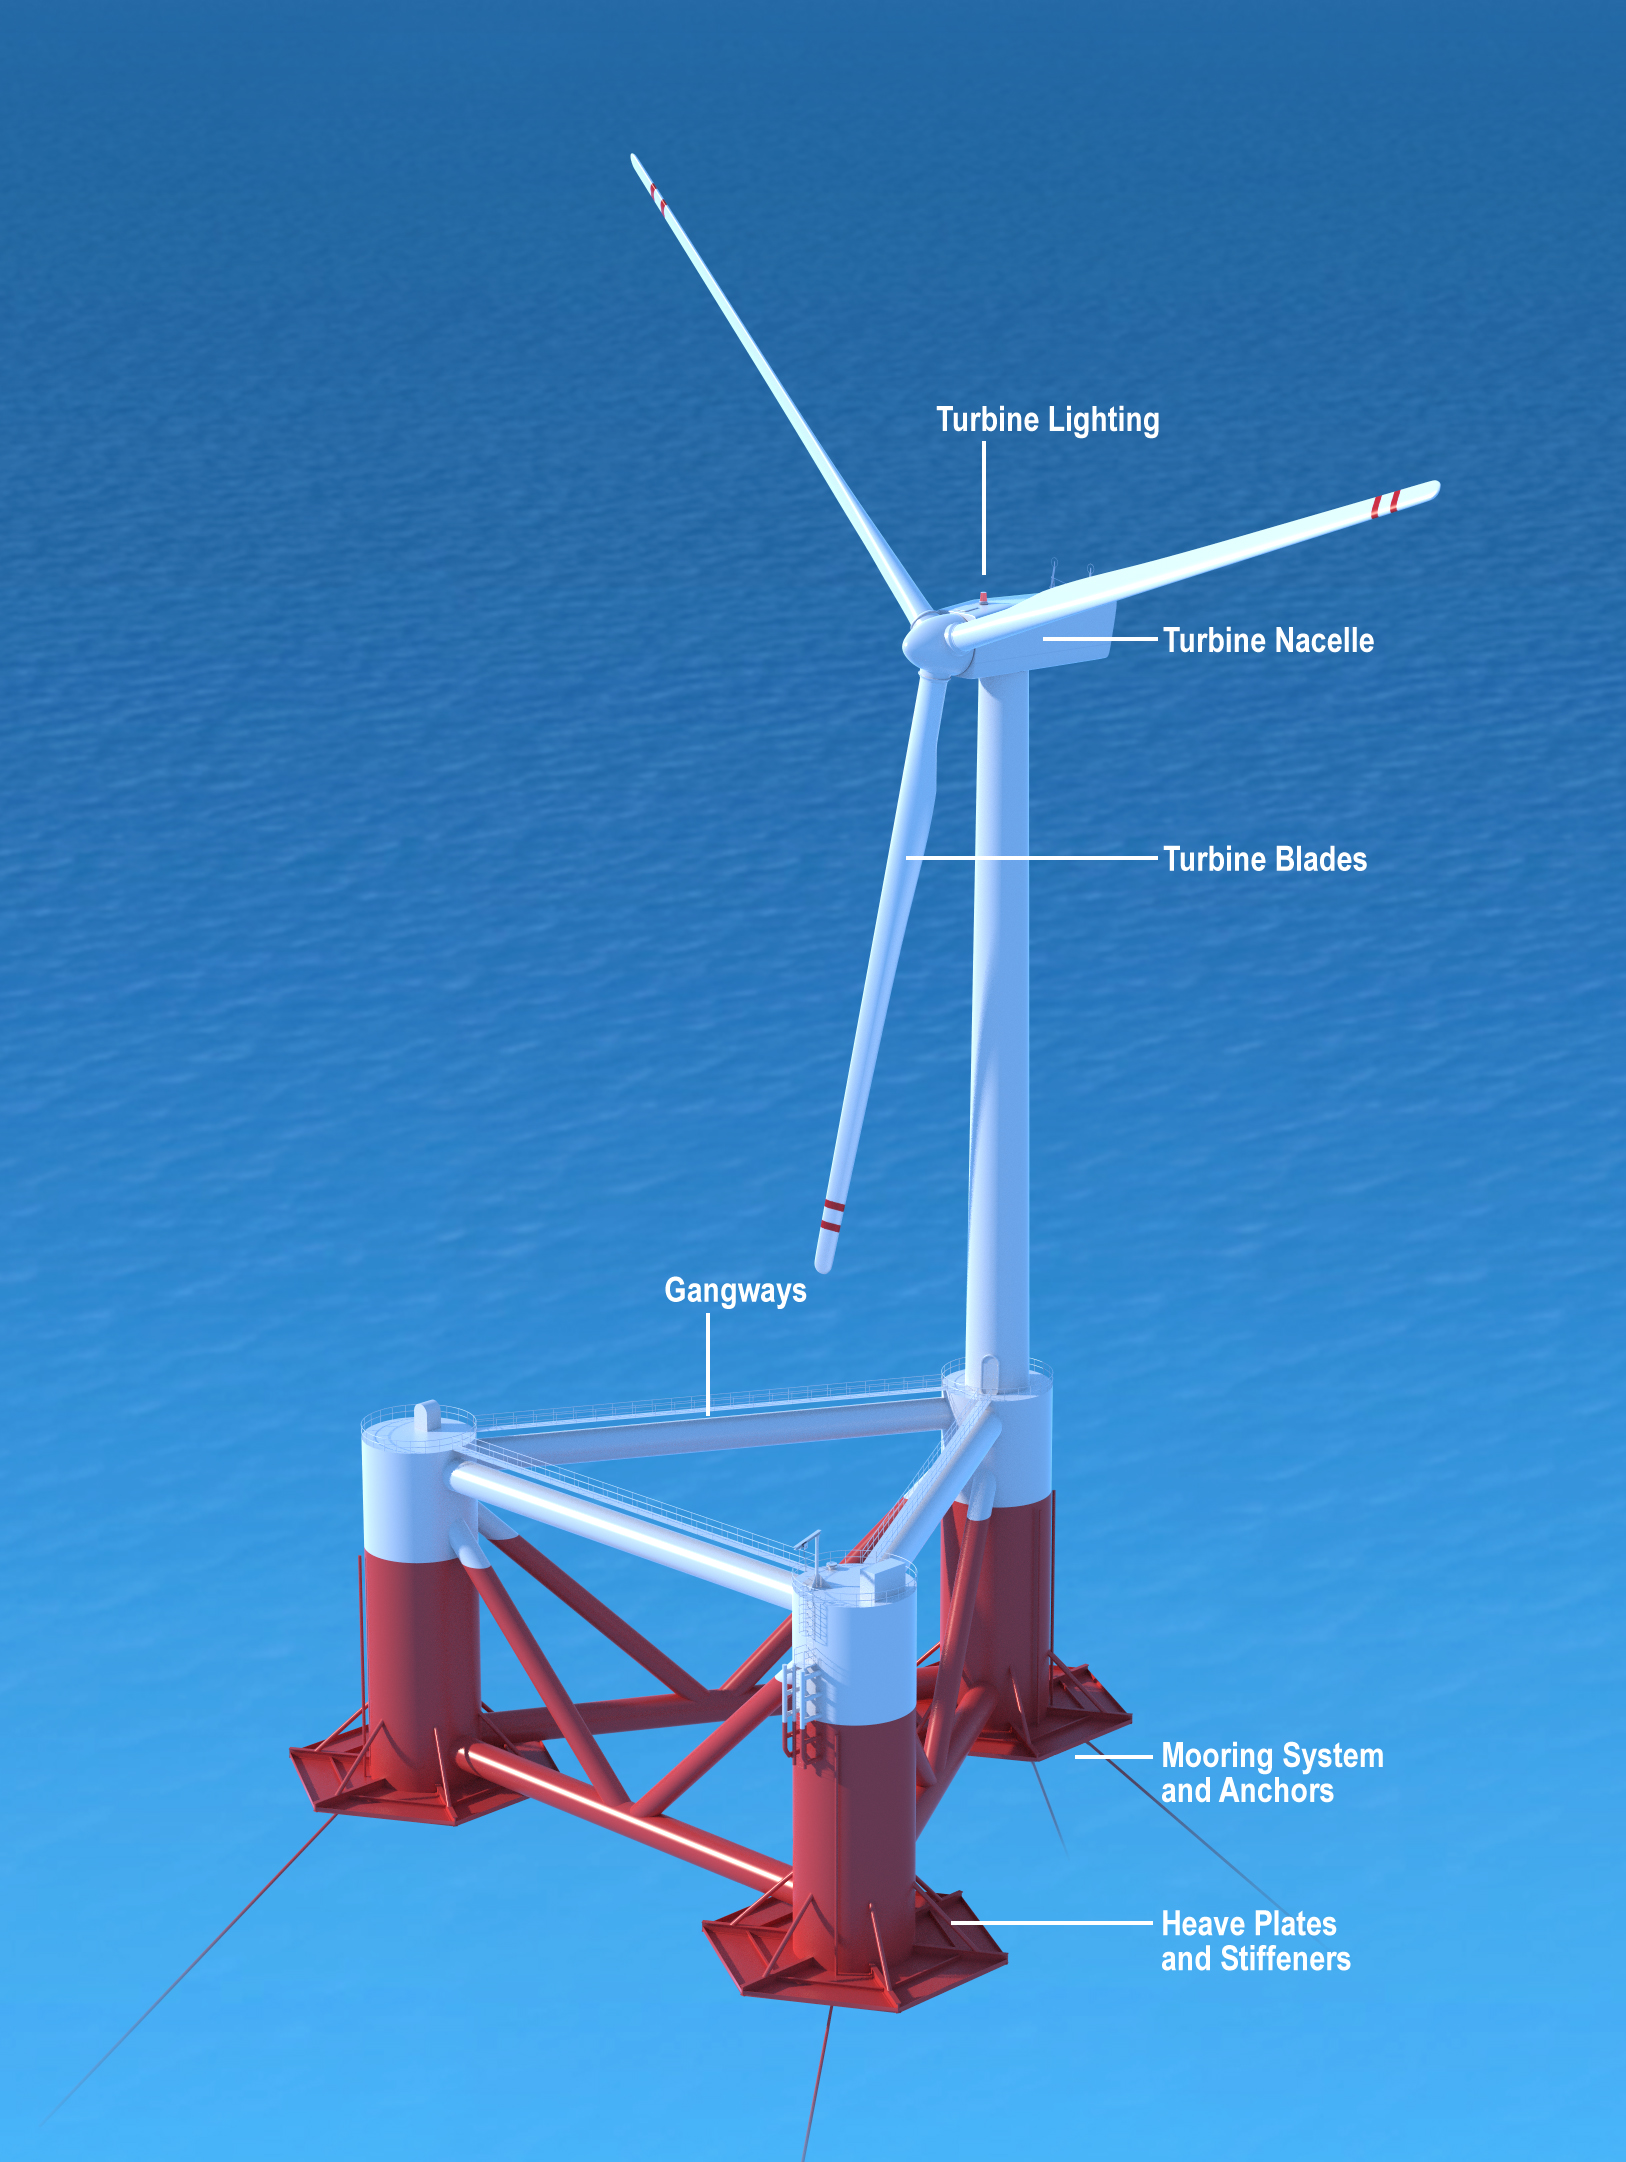
Heave plates
A common way to change the response of a system, especially in heave, is to add so-called heave plates. These are plates added at the bottom of a floating stucture.
Question
What influence do you think heave plates would have on the RAO curves?
Attention
Heave plates are difficult to model directly in a potential flow solver such as Nemoh. The cause large eddies and vortices that are not well captured by the linear potential flow theory.